 |
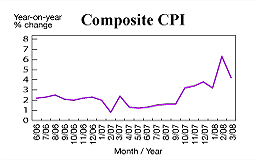
| Price check: Consumer prices in March rose 4.2% over the same month last year, but were down on February's 6.3% rise. |

|
Consumer prices in March rose 4.2% over the same month last year, but were down on February's 6.3% rise, the Census & Statistics Department says. The inflation fall is due to the low base of comparison arising from the waiver of public housing rentals in February.
The one-off policy measure of a rate concession for January to March continued to impact consumer prices in March. Netting out the effect of this factor the underlying inflation rate was 5.3%, larger than February's 5.1% figure.
The larger underlying inflation rate was due mainly to the enlarged rise in private housing rentals, prices of women's clothing and the cost of meals bought away from home.
Food price development
The pick-up in inflationary pressure in recent months was largely due to the upsurge in food prices, which was driven by global food inflation, the department said. The sustained brisk expansion of local economic activities also added pressure on prices and costs.
The inflation rate in the coming months will continue to be affected by food price developments. If the current tight supply situation in the international food market gradually eases later this year or early next year, it will help mitigate inflationary pressure.
Meanwhile, developments in the exchange rates of the US dollar and renminbi as well as local wages and rentals also need to be watched closely. Nevertheless, the various relief measures announced in the 2008-09 Budget and sustained labour productivity growth should help cushion inflation.
Food, electricity, clothing costs
March saw year-on-year increases in the price of food (excluding meals bought away from home) at 17.2%. Foods with large price hikes were pork (59.1%), beef (50.8%), canned meat (44.2%), other meat (29.5%), fresh seafood (20.3%), eggs (19.4%) and frozen meat (19.4%).
Year-on-year increases were also recorded in electricity, gas and water prices (7.1%), meals bought away from home (5.9%), miscellaneous goods (5.5%), clothing and footwear (3%), transport (2%), housing (1.9%) and alcohol and tobacco (0.4%). Year-on-year falls were recorded for durable goods (3.5%).
Go To Top
|


